|
INTERPRETING AN INFRA-RED SPECTRUM This page explains how to use an infra-red spectrum to identify the presence of a few simple bonds in organic compounds. | ||
|
Note: This page follows directly on from the introductory page on infra-red spectra. If you haven't already done so, you should read that page before you go on. | ||
|
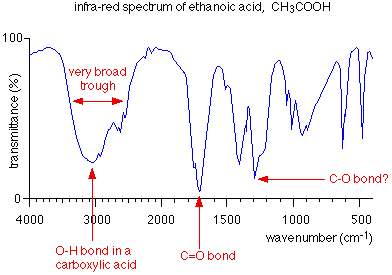
The infra-red spectrum for a simple carboxylic acid Ethanoic acid Ethanoic acid has the structure:
The carbon-carbon bond has absorptions which occur over a wide range of wavenumbers in the fingerprint region - that makes it very difficult to pick out on an infra-red spectrum. The carbon-oxygen single bond also has an absorbtion in the fingerprint region, varying between 1000 and 1300 cm-1 depending on the molecule it is in. You have to be very wary about picking out a particular trough as being due to a C-O bond. | ||
|
Note: If you aren't sure what the fingerprint region is, follow this link before you go on. | ||
|
The other bonds in ethanoic acid have easily recognised absorptions outside the fingerprint region. The C-H bond (where the hydrogen is attached to a carbon which is singly-bonded to everything else) absorbs somewhere in the range from 2853 - 2962 cm-1. Because that bond is present in most organic compounds, that's not terribly useful! What it means is that you can ignore a trough just under 3000 cm-1, because that is probably just due to C-H bonds. The carbon-oxygen double bond, C=O, is one of the really useful absorptions, found in the range 1680 - 1750 cm-1. Its position varies slightly depending on what sort of compound it is in. The other really useful bond is the O-H bond. This absorbs differently depending on its environment. It is easily recognised in an acid because it produces a very broad trough in the range 2500 - 3300 cm-1. | ||
|
Note: You will never have to remember where these absorptions occur. You will always be given this data in an A'level exam. | ||
|
The infra-red spectrum for ethanoic acid looks like this:
The possible absorption due to the C-O single bond is queried because it lies in the fingerprint region. You couldn't be sure that this trough wasn't caused by something else. | ||
|
Note: The infra-red spectra on this page have been produced from graphs taken from the Spectral Data Base System for Organic Compounds (SDBS) at the National Institute of Materials and Chemical Research in Japan. It is possible that small errors may have been introduced during the process of converting them for use on this site, but these won't affect the argument in any way. | ||
|
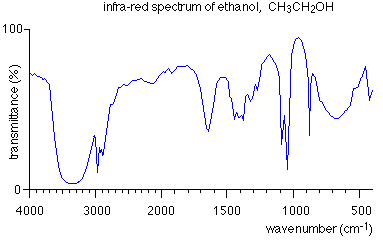
The infra-red spectrum for an alcohol Ethanol
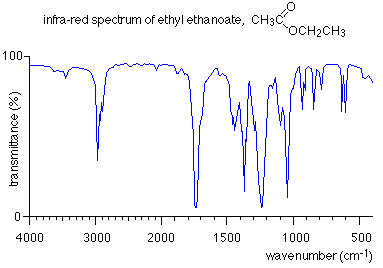
The O-H bond in an alcohol absorbs at a higher wavenumber than it does in an acid - somewhere between 3230 - 3550 cm-1. In fact this absorption would be at a higher number still if the alcohol isn't hydrogen bonded - for example, in the gas state. All the infra-red spectra on this page are from liquids - so that possibility will never apply. Notice the absorption due to the C-H bonds just under 3000 cm-1, and also the troughs between 1000 and 1100 cm-1 - one of which will be due to the C-O bond. The infra-red spectrum for an ester Ethyl ethanoate
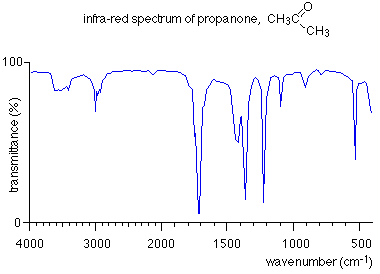
This time the O-H absorption is missing completely. Don't confuse it with the C-H trough fractionally less than 3000 cm-1. The presence of the C=O double bond is seen at about 1740 cm-1. The C-O single bond is the absorption at about 1240 cm-1. Whether or not you could pick that out would depend on the detail given by the table of data which you get in your exam, because C-O single bonds vary anywhere between 1000 and 1300 cm-1 depending on what sort of compound they are in. Some tables of data fine it down, so that they will tell you that an absorption from 1230 - 1250 is the C-O bond in an ethanoate. The infra-red spectrum for a ketone Propanone
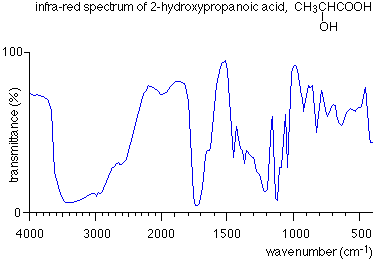
You will find that this is very similar to the infra-red spectrum for ethyl ethanoate, an ester. Again, there is no trough due to the O-H bond, and again there is a marked absorption at about 1700 cm-1 due to the C=O. Confusingly, there are also absorptions which look as if they might be due to C-O single bonds - which, of course, aren't present in propanone. This reinforces the care you have to take in trying to identify any absorptions in the fingerprint region. Aldehydes will have similar infra-red spectra to ketones. The infra-red spectrum for a hydroxy-acid 2-hydroxypropanoic acid (lactic acid)
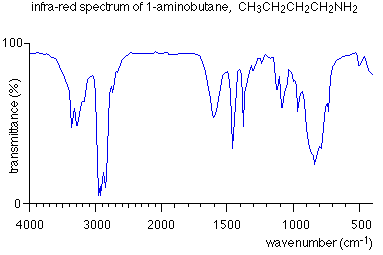
This is interesting because it contains two different sorts of O-H bond - the one in the acid and the simple "alcohol" type in the chain attached to the -COOH group. The O-H bond in the acid group absorbs between 2500 and 3300, the one in the chain between 3230 and 3550 cm-1. Taken together, that gives this immense trough covering the whole range from 2500 to 3550 cm-1. Lost in that trough as well will be absorptions due to the C-H bonds. Notice also the presence of the strong C=O absorption at about 1730 cm-1. The infra-red spectrum for a primary amine 1-aminobutane
Primary amines contain the -NH2 group, and so have N-H bonds. These absorb somewhere between 3100 and 3500 cm-1. That double trough (typical of primary amines) can be seen clearly on the spectrum to the left of the C-H absorptions.
© Jim Clark 2000 (modified August 2014) |
||