|
THIN LAYER CHROMATOGRAPHY This page is an introduction to chromatography using thin layer chromatography as an example. Although if you are a beginner you may be more familiar with paper chromatography, thin layer chromatography is equally easy to describe and more straightforward to explain. | ||
|
Note: I'm taking a simple view of the way that thin layer chromatography works in terms of adsorption (see below) which should be adequate for students doing courses for 16 - 18 year olds. The reality is more complicated and the explanation will vary depending on what sort of solvent or solvent mixture you are using. Some similar problems are discussed on the page about paper chromatography, but I am unwilling to do the same thing on this page which is intended as a fairly gentle introduction to chromatography. | ||
|
Carrying out thin layer chromatography Background Chromatography is used to separate mixtures of substances into their components. All forms of chromatography work on the same principle. They all have a stationary phase (a solid, or a liquid supported on a solid) and a mobile phase (a liquid or a gas). The mobile phase flows through the stationary phase and carries the components of the mixture with it. Different components travel at different rates. We'll look at the reasons for this further down the page. Thin layer chromatography is done exactly as it says - using a thin, uniform layer of silica gel or alumina coated onto a piece of glass, metal or rigid plastic. The silica gel (or the alumina) is the stationary phase. The stationary phase for thin layer chromatography also often contains a substance which fluoresces in UV light - for reasons you will see later. The mobile phase is a suitable liquid solvent or mixture of solvents. Producing the chromatogram We'll start with a very simple case - just trying to show that a particular dye is in fact a mixture of simpler dyes.
| ||
|
Note: The chromatography plate will in fact be pure white - not pale grey. I'm forced to show it as off-white because of the way I construct the diagrams. Anything I draw as pure white allows the background colour of the page to show through. | ||
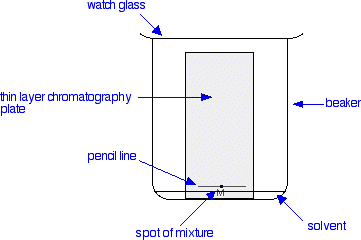
|
A pencil line is drawn near the bottom of the plate and a small drop of a solution of the dye mixture is placed on it. Any labelling on the plate to show the original position of the drop must also be in pencil. If any of this was done in ink, dyes from the ink would also move as the chromatogram developed. When the spot of mixture is dry, the plate is stood in a shallow layer of solvent in a covered beaker. It is important that the solvent level is below the line with the spot on it. The reason for covering the beaker is to make sure that the atmosphere in the beaker is saturated with solvent vapour. To help this, the beaker is often lined with some filter paper soaked in solvent. Saturating the atmosphere in the beaker with vapour stops the solvent from evaporating as it rises up the plate. As the solvent slowly travels up the plate, the different components of the dye mixture travel at different rates and the mixture is separated into different coloured spots.
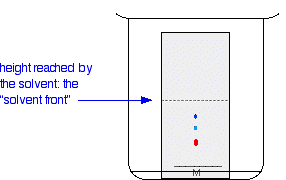
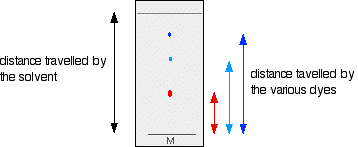
The diagram shows the plate after the solvent has moved about half way up it. The solvent is allowed to rise until it almost reaches the top of the plate. That will give the maximum separation of the dye components for this particular combination of solvent and stationary phase. Measuring Rf values If all you wanted to know is how many different dyes made up the mixture, you could just stop there. However, measurements are often taken from the plate in order to help identify the compounds present. These measurements are the distance travelled by the solvent, and the distance travelled by individual spots. When the solvent front gets close to the top of the plate, the plate is removed from the beaker and the position of the solvent is marked with another line before it has a chance to evaporate. These measurements are then taken:
The Rf value for each dye is then worked out using the formula:
For example, if the red component travelled 1.7 cm from the base line while the solvent had travelled 5.0 cm, then the Rf value for the red dye is:
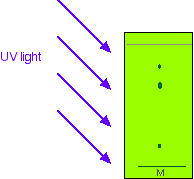
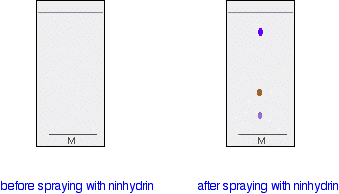
If you could repeat this experiment under exactly the same conditions, then the Rf values for each dye would always be the same. For example, the Rf value for the red dye would always be 0.34. However, if anything changes (the temperature, the exact composition of the solvent, and so on), that is no longer true. You have to bear this in mind if you want to use this technique to identify a particular dye. We'll look at how you can use thin layer chromatography for analysis further down the page. What if the substances you are interested in are colourless? There are two simple ways of getting around this problem. Using fluorescence You may remember that I mentioned that the stationary phase on a thin layer plate often has a substance added to it which will fluoresce when exposed to UV light. That means that if you shine UV light on it, it will glow. That glow is masked at the position where the spots are on the final chromatogram - even if those spots are invisible to the eye. That means that if you shine UV light on the plate, it will all glow apart from where the spots are. The spots show up as darker patches.
While the UV is still shining on the plate, you obviously have to mark the positions of the spots by drawing a pencil circle around them. As soon as you switch off the UV source, the spots will disappear again. Showing the spots up chemically In some cases, it may be possible to make the spots visible by reacting them with something which produces a coloured product. A good example of this is in chromatograms produced from amino acid mixtures. The chromatogram is allowed to dry and is then sprayed with a solution of ninhydrin. Ninhydrin reacts with amino acids to give coloured compounds, mainly brown or purple.
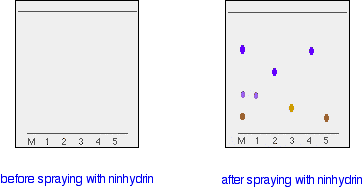
In another method, the chromatogram is again allowed to dry and then placed in an enclosed container (such as another beaker covered with a watch glass) along with a few iodine crystals. The iodine vapour in the container may either react with the spots on the chromatogram, or simply stick more to the spots than to the rest of the plate. Either way, the substances you are interested in may show up as brownish spots. Using thin layer chromatography to identify compounds Suppose you had a mixture of amino acids and wanted to find out which particular amino acids the mixture contained. For simplicity we'll assume that you know the mixture can only possibly contain five of the common amino acids. A small drop of the mixture is placed on the base line of the thin layer plate, and similar small spots of the known amino acids are placed alongside it. The plate is then stood in a suitable solvent and left to develop as before. In the diagram, the mixture is M, and the known amino acids are labelled 1 to 5. The left-hand diagram shows the plate after the solvent front has almost reached the top. The spots are still invisible. The second diagram shows what it might look like after spraying with ninhydrin.
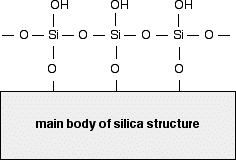
There is no need to measure the Rf values because you can easily compare the spots in the mixture with those of the known amino acids - both from their positions and their colours. In this example, the mixture contains the amino acids labelled as 1, 4 and 5. And what if the mixture contained amino acids other than the ones we have used for comparison? There would be spots in the mixture which didn't match those from the known amino acids. You would have to re-run the experiment using other amino acids for comparison. How does thin layer chromatography work? The stationary phase - silica gel Silica gel is a form of silicon dioxide (silica). The silicon atoms are joined via oxygen atoms in a giant covalent structure. However, at the surface of the silica gel, the silicon atoms are attached to -OH groups. | ||
|
Note: If you aren't sure about it, you will find one possible structure of silicon dioxide towards the bottom of the page you will get to by following this link. Use the BACK button on your browser to return quickly to this page. | ||
|
So, at the surface of the silica gel you have Si-O-H bonds instead of Si-O-Si bonds. The diagram shows a small part of the silica surface.
The surface of the silica gel is very polar and, because of the -OH groups, can form hydrogen bonds with suitable compounds around it as well as van der Waals dispersion forces and dipole-dipole attractions. | ||
|
Note: If you aren't sure about hydrogen bonds and van der Waals forces follow this link to the page about hydrogen bonding. You will find a further link to van der Waals forces at the bottom of that page. Use the BACK button on your browser to return quickly to this page. | ||
|
The other commonly used stationary phase is alumina - aluminium oxide. The aluminium atoms on the surface of this also have -OH groups attached. Anything we say about silica gel therefore applies equally to alumina. What separates the compounds as a chromatogram develops? As the solvent begins to soak up the plate, it first dissolves the compounds in the spot that you have put on the base line. The compounds present will then tend to get carried up the chromatography plate as the solvent continues to move upwards. How fast the compounds get carried up the plate depends on two things:
Suppose the original spot contained two compounds - one of which can form hydrogen bonds, and one of which can only take part in weaker van der Waals interactions. The one which can hydrogen bond will stick to the surface of the silica gel more firmly than the other one. We say that one is adsorbed more strongly than the other. Adsorption is the name given to one substance forming some sort of bonds to the surface of another one. Adsorption isn't permanent - there is a constant movement of a molecule between being adsorbed onto the silica gel surface and going back into solution in the solvent. Obviously the compound can only travel up the plate during the time that it is dissolved in the solvent. While it is adsorbed on the silica gel, it is temporarily stopped - the solvent is moving on without it. That means that the more strongly a compound is adsorbed, the less distance it can travel up the plate. In the example we started with, the compound which can hydrogen bond will adsorb more strongly than the one dependent on van der Waals interactions, and so won't travel so far up the plate. What if both components of the mixture can hydrogen bond? It is very unlikely that both will hydrogen bond to exactly the same extent, and be soluble in the solvent to exactly the same extent. It isn't just the attraction of the compound for the silica gel which matters. Attractions between the compound and the solvent are also important - they will affect how easily the compound is pulled back into solution away from the surface of the silica. However, it may be that the compounds don't separate out very well when you make the chromatogram. In that case, changing the solvent may well help - including perhaps changing the pH of the solvent. This is to some extent just a matter of trial and error - if one solvent or solvent mixture doesn't work very well, you try another one. (Or, more likely, given the level you are probably working at, someone else has already done all the hard work for you, and you just use the solvent mixture you are given and everything will work perfectly!) | ||
|
Note: You will find detailed descriptions with photographs of how to carry out thin layer chromatography archived from the Colorado University site. There is also a very detailed description of thin layer chromatography by an experienced organic chemist on this site. Linking to other sites is always a little bit hazardous because sites change. If you find that these links don't work, please contact me via the address on the About this site page.
| ||
© Jim Clark 2007 (last modified December 2019) |
||